Untitled Document
1. Profits are up, but the wages and incomes of average Americans are
down.
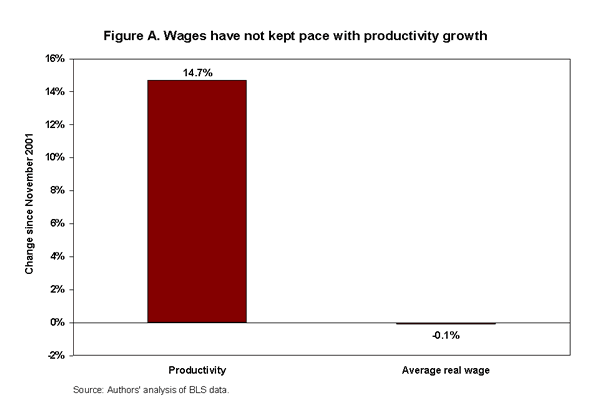
Inflation-adjusted hourly and weekly wages are below where they were at the
start of the recovery in November 2001. Yet, productivity—the growth
of the economic pie—is up by 14.7%.1 (Figure A)
Wage growth has been shortchanged because 46% of the growth of total income
in the corporate sector has been distributed as corporate profits, far more
than the 20% in previous periods.2
Consequently, median household income (inflation-adjusted) has fallen five
years in a row and was 4% lower in 2004 than in 1999, falling from $46,129
to $44,389.3

2. More and more people are deeper and deeper in debt.
The indebtedness of U.S. households, after adjusting for inflation, has risen
42.0% over the last five years. 4
The level of debt as a percent of after-tax income is the highest ever measured
in our history. Mortgage and consumer debt is now 120% of after-tax income,
more than twice the level of 30 years ago.5
The debt-service ratio (the percent of after-tax income that goes to pay
off debts) is at an all-time high of 13.9%.6
The personal savings rate is negative for the first time since the Depression.7
3. Job creation has not kept up with population growth, and the employment
rate has fallen sharply.
The United States has only 1.9% more jobs today than in March 2001 (the start
of the last recession). Private sector jobs are up only 1.5%. At this stage
of previous business cycles, jobs had grown by an average of 8.8% and never
less than 6.0%.8
The unemployment rate is relatively low at 4.6%. But the percent of the
population that has a job has never recovered since the recession and is still
1.3% lower than in March 2001. If the employment rate had returned to pre-recession
levels, almost 4 million more people would be employed.9
More than 3 million manufacturing jobs have been lost since 2000.10
4. Poverty is on the rise.
The poverty rate rose from 11.3% in 2000 to 12.7% in 2004.11
The number of people living in poverty has increased by 5.4 million since
2000.12
More children are living in poverty: the child poverty rate increased from
16.2% in 2000 to 17.8% in 2004.13
5. Rising health care costs are eroding families' already declining
income.
Households are spending more on health care. Family health costs rose 43-45%
for married couples with children, single mothers, and young singles from
2000 to 2003.14
Employers are cutting back on health insurance. Last year, the percent of
people with employer-provided health insurance fell for the fourth year in
a row. Nearly 3.7 million fewer people had employer-provided insurance in
2004 than in 2000. Taking population growth into account, 11 million more
people would have had employer-provided health insurance in 2004 if the coverage
rate had remained at the 2000 level.15
SOURCES
1. Bureau of Labor Statistics, Current Employment Statistics
Survey. 2006 http://www.bls.gov/ces/home.htm.
BLS, Labor Productivity and Costs. 2006. http://www.bls.gov/lpc/home.htm.
Productivity is non-farm business output per hour.
2. Bureau of Economic Analysis. 2006. NIPA Table 1.14. http://www.bea.gov/bea/dn/nipaweb/index.asp.
3. U.S. Census Bureau. Income, Poverty, and Health Insurance
Coverage in the United States. 2004. http://www.census.gov/hhes/www/income/income.html.
4. Federal Reserve. 2006. Flow of Funds Accounts, balance
sheet tables: total household liabilities. http://www.federalreserve.gov/releases/z1/.
Deflated using CPI-U from the Bureau of Labor Statistics.
5. For disposable income: Bureau of Economic Analysis, NIPA
Table 2.1. 2006. For mortgage and consumer debt: Federal Reserve Flow of Funds
Accounts, balance sheet tables. 2006. http://www.federalreserve.gov/releases/z1/.
6. Federal Reserve. 2006. http://www.federalreserve.gov/releases/housedebt/default.htm.
7. Bureau of Economic Analysis. 2006. NIPA Table 2.1. http://www.bea.gov/bea/dn/nipaweb/index.asp.
8. Bureau of Labor Statistics, Current Employment Statistics
Survey. 2006. (total nonfarm employees and total private employees data.) See
also Price, Lee. 2005. The Boom That Wasn't. EPI Briefing Paper #168. http://www.epi.org/content.cfm/bp168.
9. Analysis of Bureau of Labor Statistics data. See also Bernstein,
Jared and Lee Price. 2005. An Off-Kilter Expansion. EPI Briefing Paper #164.
http://www.epi.org/content.cfm/bp164.
10. Bureau of Labor Statistics, Current Employment Statistics
Survey. 2006. http://www.bls.gov/ces/home.htm.
See also Bivens, Josh. 2005. "Trade deficits and manufacturing employment."
Economic Snapshot. Nov. 20. http://www.epi.org/content.cfm/webfeatures_snapshots_20051130.
11. U.S. Census Bureau. Income, Poverty, and Health Insurance
Coverage in the United States: 2004. http://www.census.gov/hhes/www/income/income.html.
12. U.S. Census Bureau. Income, Poverty, and Health Insurance
Coverage in the United States: 2004. http://www.census.gov/hhes/www/income/income.html.
13. U.S. Census Bureau. Income, Poverty, and Health Insurance
Coverage in the United States: 2004.
http://www.census.gov/hhes/www/income/income.html.
14. Mishel, Lawrence et al. 2004. Less Cash in Their Pockets.
EPI Briefing Paper #154. http://www.epi.org/content.cfm/bp154.
15. Mishel, Lawrence et al. 2004. Less Cash in Their Pockets.
EPI Briefing Paper #154. http://www.epi.org/content.cfm/bp154.
__________________
Read from Looking Glass News
Wall Street Declares War on Wages
http://www.lookingglassnews.org/viewstory.php?storyid=6118
All "Economic News" articles
http://www.lookingglassnews.org/index.php?topic=13

